
The Big Seven: Why Numbers Matter in Astrophotography

Photo by Josh Gordon
Astrophotography is often described as a mix of art and science, and nowhere is that more true than when you're diving into the technical numbers behind your imaging session. While the beauty of a final image might capture hearts, it’s the data behind the scenes that determines its quality. From HFR to RMS, SQM to Star Count, these numbers are the silent narrators of your night under the stars. Understanding and monitoring them can make or break your imaging session. Understanding them, keeping en eye on them and trying to improve these numbers will definitely lead to capturing better data which will result in a far better final image.
Below, we’ll walk through seven key metrics every astrophotographer should know, what they mean, and why watching how they change during a session is just as crucial as the numbers themselves. These seven numbers are:
HFR, RMS, Mean ADU, SQM, Star Count, Eccentricity and SNR.
“Don’t be discouraged by the abbreviations and not knowing what they mean. In this article we have tried to explain what they mean and how you can monitor them to improve your space photos.”
Essential Metrics for Astrophotographers
1. HFR (Half-Flux Radius)
HFR is a measure of star size, representing the radius at which half of a star’s light is concentrated. It’s one of the most reliable indicators of focus quality.
Low HFR = sharp stars
High or increasing HFR = poor or drifting focus
You want this number to be as low and stable as possible. Tools like NINA and ASIAIR calculate HFR for every frame, helping you identify when refocusing is needed. It is important to emohasise that the HFR numbers that you have are unique to you, depending on your astrophotography gear and you seeing condition. What is cruacial is to keep your HFR number as low as possible and more importantly monitor it regularly to ensure it will stay down.
2. RMS Guiding Error
Root Mean Square (RMS) error is your mount’s performance report card. It tells you how well your guiding is keeping up with the movement of the sky.
Values below 1 arcsecond are typically good
Consistency is key: stable RMS is better than fluctuating values
RMS can be split into RA (right ascension) and DEC (declination) values. If one is much higher than the other, something’s off in your setup. Emeasures such as nailing the polar alignment and guiding on PHD2 Guiding can significantly improve your tracking performance.
Find out more about using a ZWO AM5N Harmonic Equatorial Mount here.
It is crucial to check that the low RMS match your stars shape. Don’t purely focus on the RMS number.
3. Mean Readout (Mean ADU)
This tells you the average brightness across your frame. It helps you judge exposure and sky background brightness. An imaging software like NINA will give you the mean readout for each and every image you capture.
Too low? Your image may be underexposed.
Too high? You might be overexposing or dealing with light pollution or moonlight.
4. SQM (Sky Quality Meter)
Measured in magnitudes per arcsecond², this value tells you how dark your sky is. A higher number means a darker sky.

SQM incorporated in each sub.
Bortle 1 skies = 21.9+ SQM
Suburban areas = 18–20 SQM
The Unihedron SQM-LU model is ASCOM compatible and integrates with platforms like NINA, embedding sky brightness values into your image metadata for ongoing sky quality monitoring.
Regardless the level of light pollution you have to deal with, there are many ways you can work around it, adapt and ajust. Find out more by reading our Astrophotography Anywhere article.
5. Star Count
Software like NINA or PixInsight counts how many stars it detects in each sub-exposure. This can reflect seeing conditions, focus quality, and transparency.
Falling star count? Check for clouds, dew, or fog.
Stable count with low HFR? You’re in good shape.
6. Eccentricity
This measures how round your stars are. A value near 0.4 is ideal; higher values mean elongated stars, often due to poor tracking, inaccurate back-focus or tilt issues.
7. Signal to Noise Ratio (SNR)
Signal to Noise Ratio (SNR) is a crucial measure of image quality. It determines the strength of the “good” signal (deep space objects) relative to the unwanted noise (random variations in brightness). A high SNR indicates a clear image with well-defined details, while a low SNR results in a noisy image where details are difficult to discern. Achieving a high SNR is essential for capturing sharp, detailed images of the night sky.

Photo by Guillermo Ferla
Why Monitoring Trends Is Just as Important as the Numbers Themselves:
Tracking a single value (like an HFR of 2.1 or an RMS of 0.8) is helpful. But watching how those numbers change over time is where the real magic happens. Trends tell you the story of your imaging session in real-time, and they can be your earliest warning system when things start going sideways.
Here’s what to look for AND what it might mean:
| Issue | What It Means | What to Do |
|---|---|---|
| Gradual Increase in HFR | Focus might be slipping due to temperature shifts or mechanical drift. | Refocus manually or enable temperature-compensating autofocus routines. |
| Sudden Drop in Star Count | Likely obstruction from clouds, dew, or a cable snag. | Pause session and inspect optics, cables, and sky conditions. |
| Rising RMS Guiding Error | Indicates mount imbalance, poor seeing, or cable drag. | Check for snags and consider recalibrating guiding setup. |
| Changes in Mean Readout | Could suggest clouds passing (drop) or moonlight/nearby lights (spike). | Adjust exposure settings or pause narrowband imaging if needed. |
| Increasing Eccentricity | Stars becoming stretched due to tilt, sag, or flexure. | Check connections and consider tilt adjustment—especially for full-frame sensors. |
| Dropping SNR | Can result from light pollution, cloud cover, or poor guiding. | Improve calibration, and try imaging under better sky conditions. |
One tool to evaluate the quality of your frames after imaging, is SubframeSelector in PixInsight.
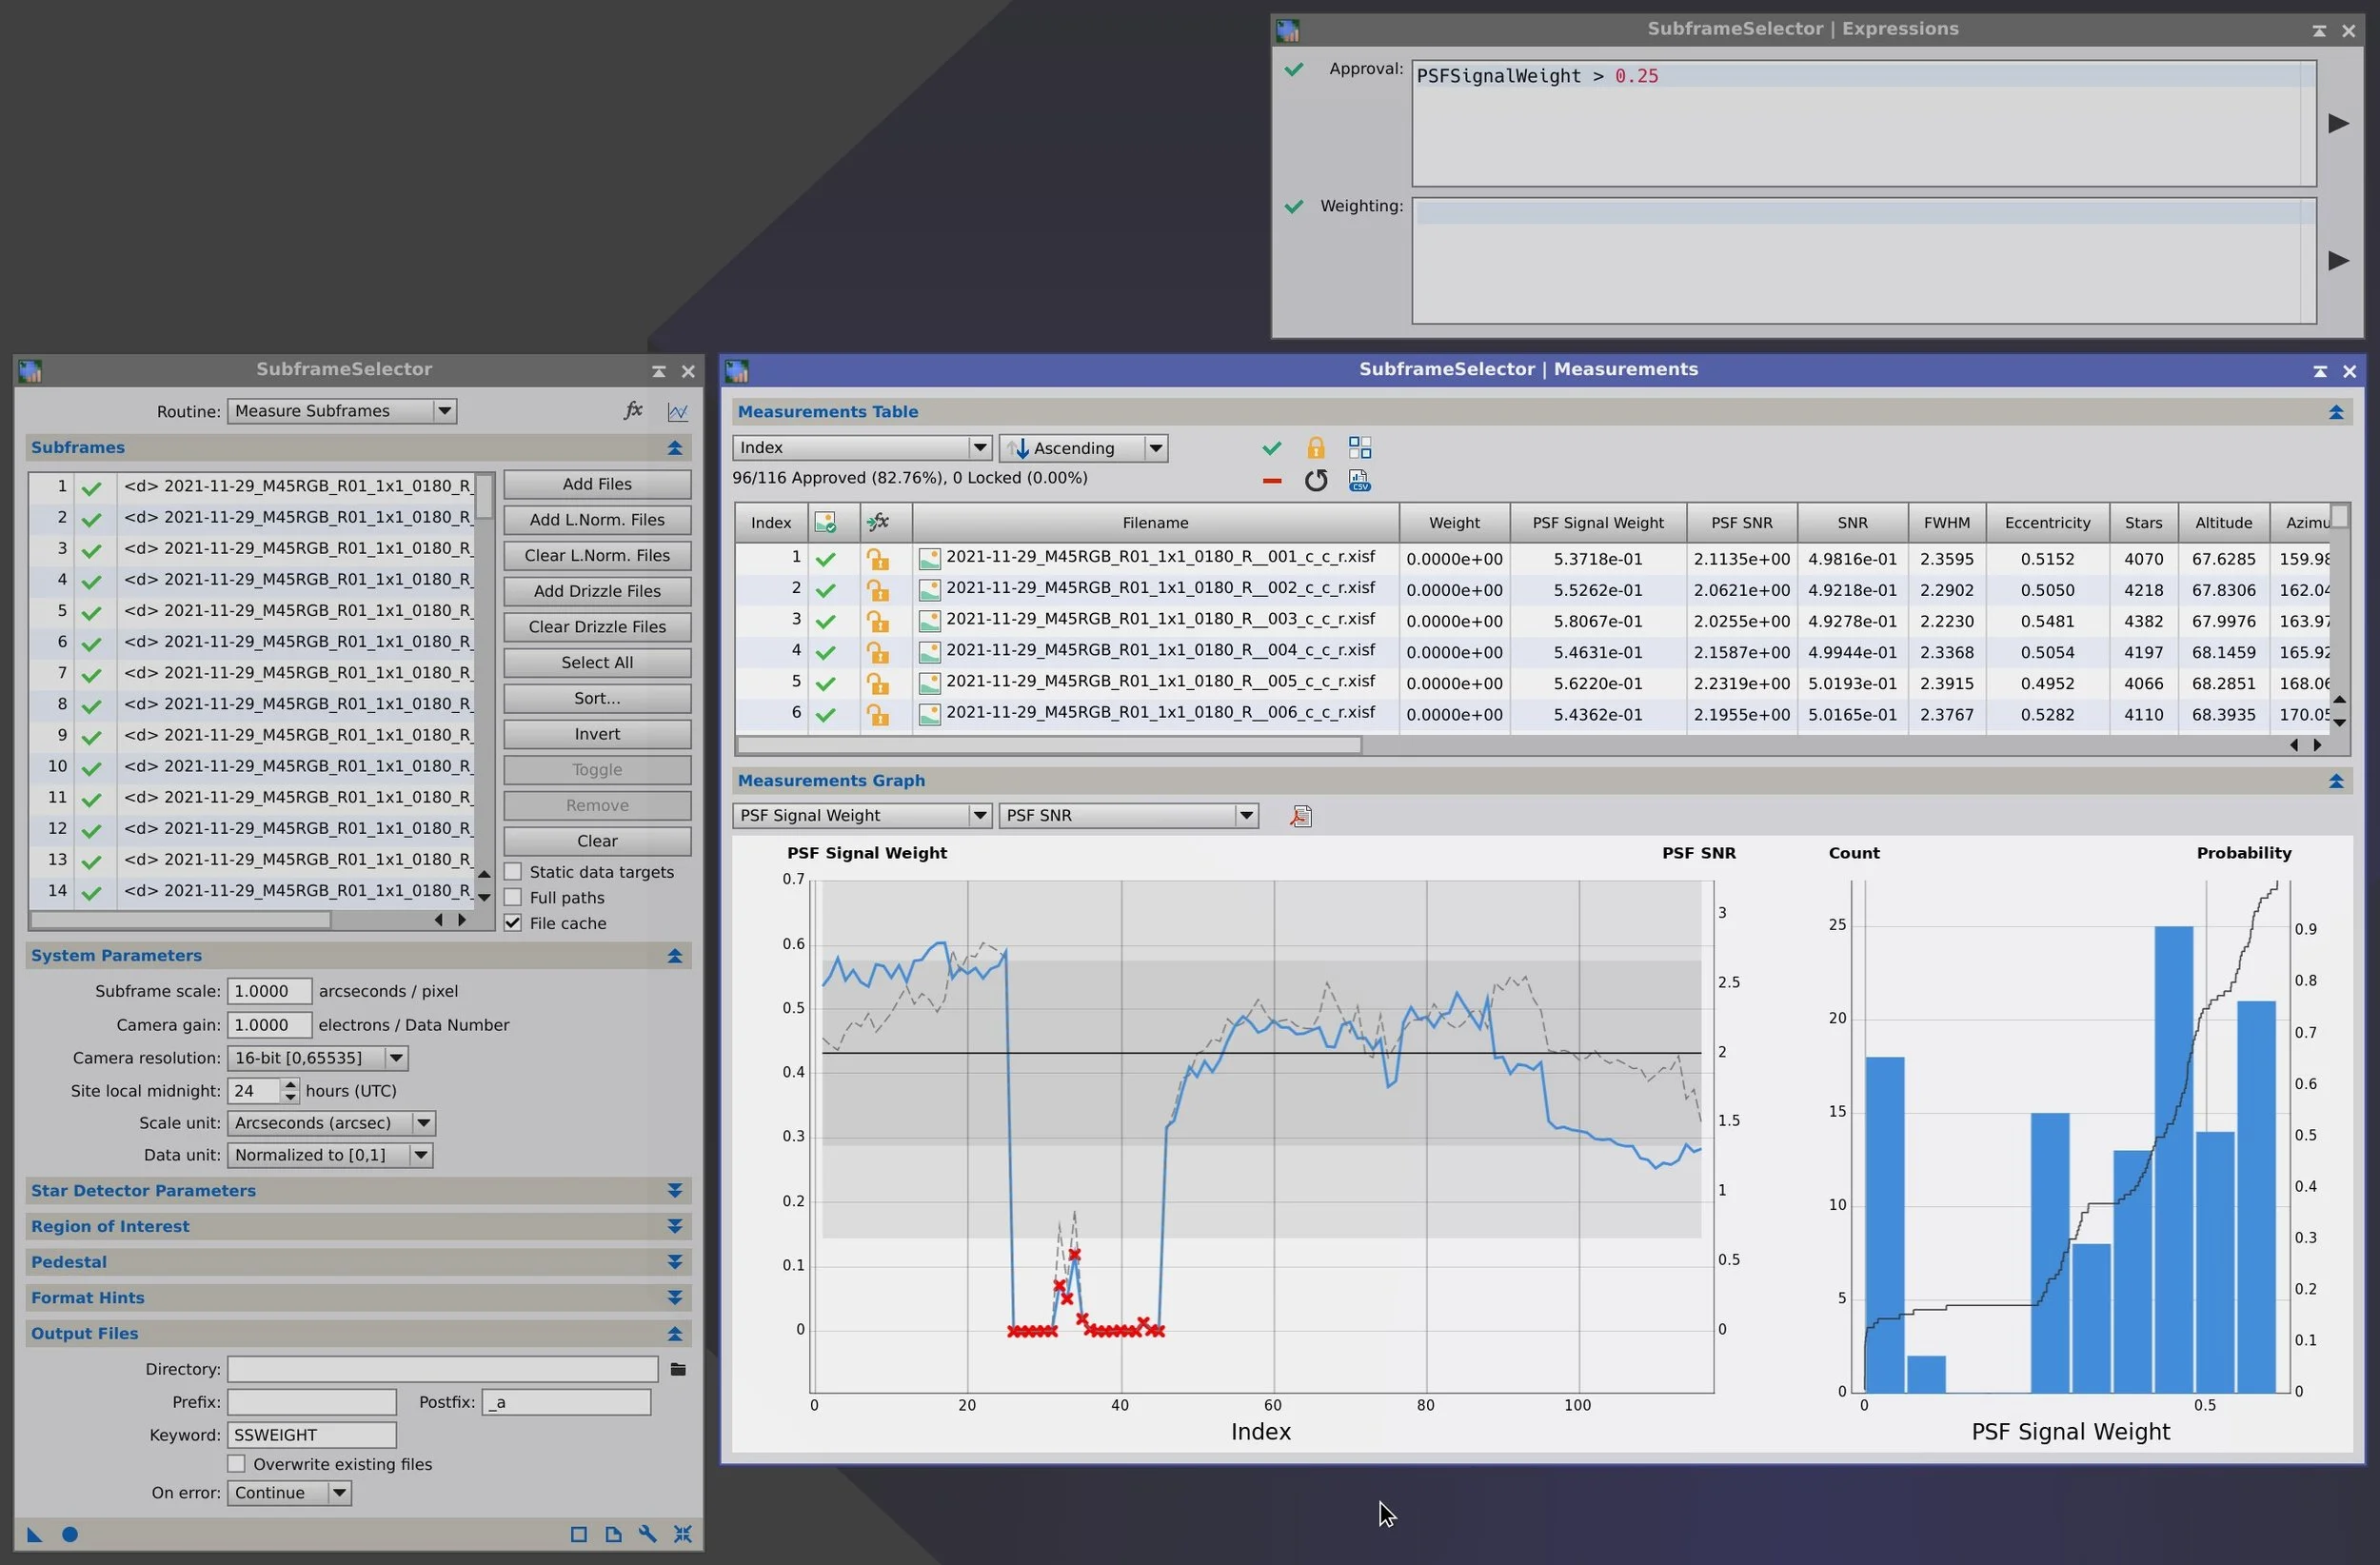
“The SubframeSelector tool supports a new set of variables (also called properties) for image selection and weighting, as well as for subframe sorting and graph generation.” From PixInsight’s Documentation
Numbers Matter, But…
These numbers may seem intimidating at first, but they offer powerful insights into your setup, environment, and overall image quality. By understanding and tracking them, not just individually, but as part of a larger narrative, you equip yourself to make better decisions, troubleshoot faster, and achieve consistent, high-quality results.
That said, focusing on numbers alone is not enough. Numbers are diagnostic tools, but they don’t tell the whole story. You should always inspect your individual sub-exposures visually, check for trailing stars, gradients, noise, or other anomalies that metrics alone might not fully capture. A low HFR means nothing if a gust of wind ruined half your frame. Good numbers should reflect in good-looking subs; and if they don’t, you’ll need to dig deeper.
Whether you're dialling in perfect focus, choosing the best exposure settings, or judging whether to keep or toss a sub-frame, metrics like HFR, RMS, SQM, and more are your best friends under the stars. But your own judgement, and your eye on each sub has to have the final say.
So next time you're out imaging, don’t just look up, look at the numbers, then look at your subs, and make sure the reflect each other.
“Numbers in astrophotography are diagnostic tools, but they don’t tell the whole story. ”
To enahnce your astrophotography workflow, we strongly recommend that you read our article 14 Underrated Astrophotography Accessories That Will Transform Your Workflow.